The (Un)Luckiest Season of All
Depending on which statistics you look at, the Seattle Mariners had either the luckiest or unluckiest season in recent memory... #SchrodingersBaseballTeam
On September 19th, the Seattle Mariners were 84-68, a record that in any other season would send even the ficklest Seattle fan clamoring for their suddenly fashionable Griffey jerseys gathering dust in the back of their closets. But in this logic-defying year of baseball, their season was effectively over despite being a game or less behind four of the ten available playoff spots. With the A’s and Astros streaking into October, what would normally amount to at least a playoff chase was reduced to nothing more than consolation games.
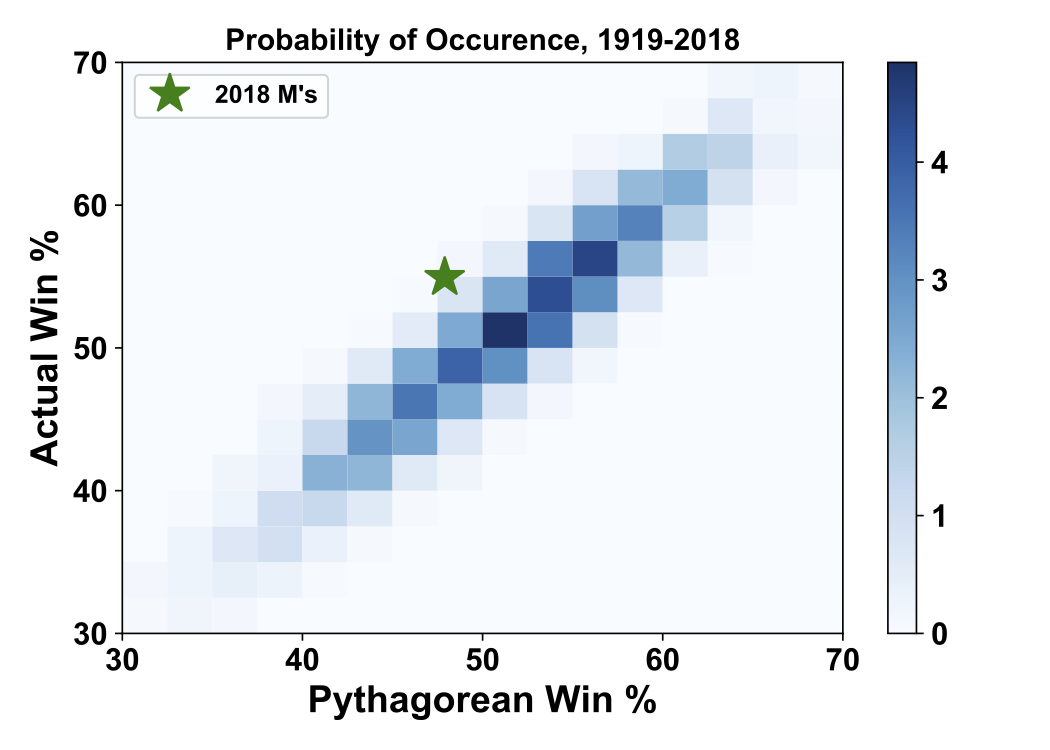 But before we dive too far into self-pity, Mariners fans should probably be thankful that they even got this far considering the team’s performance in terms of runs. The easiest stat to point to is run differential where, despite having won more games than lost, the M’s allowed 34 more runs than they scored. But the far more interesting stat is the Pythagorean Win Expectancy (PWE). According to this metric, they should be sitting at a .478 win percentage, a season-long difference of 12 games compared to the Mariners’ final .549 pace. Obviously, credit has to be given to the Herculean effort of Edwin Diaz and his 57 saves, but a little bit of luck had to have been involved, considering that only nine other teams since the deadball era have ever outperformed their PWE by more. (One notable example of these outperformers is the 1981 Reds, who actually got shafted much harder than this year’s M’s due to a strike-shortened season. Despite having the best overall record in the NL, a midseason strike reset the standings, leaving Ken Griffey Sr. out in the cold.)
 Just to give you an idea of how unlucky/lucky this season has been, a team with 89 wins (as the Mariners ended up with) makes the playoffs about 70% of the time according to a logistic regression run by FiveThirtyEight. But a team with just 77 wins (as the M’s PWE projects them to have) makes the playoffs less than 1% of the time. The bottom line is that while we should have a better view of the mythical land of playoff baseball, the fact that we’re within a nautical mile is a miracle in itself.
But that doesn’t take away any of the sting, does it? Why is a franchise that has had notoriously terrible playoff luck in recent years getting clubbed over the head by the baseball gods once again? In 2016, Rob Arthur unsurprisingly crowned the Seattle Mariners the “Unluckiest MLB Franchise Since 1998” by comparing the number of actual and expected playoff appearances based on regular season records. If we update this to include the last two seasons, it gets even worse. Based on their records, the Mariners should have been to the playoffs an additional three times in the last two decades, almost twice as many as the nearest franchise. Even if we utilize the PWE instead of the actual win percentage to calculate expected playoff appearances, the M’s remain the unluckiest team by almost an entire playoff berth.
Playoff Karma By MLB Franchise
| Franchise | Actual | Expected | Difference | Expected (PWE) | Difference (PWE) |
|---|---|---|---|---|---|
| Seattle Mariners | 2 | 5.27 | 3.27 | 4.91 | 2.91 |
| Boston Red Sox | 12 | 13.44 | 1.44 | 13.35 | 1.35 |
| Tampa Bay Rays | 4 | 5.26 | 1.26 | 4.64 | 0.64 |
| Los Angeles Angels | 7 | 8.24 | 1.24 | 6.05 | -0.95 |
| San Francisco Giants | 7 | 8.06 | 1.06 | 7.6 | 0.6 |
| Toronto Blue Jays | 2 | 2.72 | 0.72 | 4.02 | 2.02 |
| Chicago White Sox | 3 | 3.67 | 0.67 | 3.38 | 0.38 |
| Cincinnati Reds | 3 | 3.56 | 0.56 | 3.8 | 0.8 |
| Cleveland Indians | 8 | 8.53 | 0.53 | 8.19 | 0.19 |
| Washington Nationals | 4 | 4.5 | 0.5 | 5.73 | 1.73 |
| Oakland Athletics | 9 | 9.24 | 0.24 | 8.82 | -0.18 |
| New York Mets | 5 | 5.21 | 0.21 | 4.38 | -0.62 |
| Kansas City Royals | 2 | 2.09 | 0.09 | 1.4 | -0.6 |
| Miami Marlins | 1 | 1.04 | 0.04 | 0.32 | -0.68 |
| Milwaukee Brewers | 3 | 3.02 | 0.02 | 2.18 | -0.82 |
| Detroit Tigers | 5 | 4.98 | -0.02 | 3.73 | -1.27 |
| Baltimore Orioles | 3 | 2.91 | -0.09 | 1.59 | -1.41 |
| Philadelphia Phillies | 5 | 4.86 | -0.14 | 5.13 | 0.13 |
| Texas Rangers | 7 | 6.8 | -0.2 | 4.49 | -2.51 |
| Pittsburgh Pirates | 3 | 2.62 | -0.38 | 2.03 | -0.97 |
| San Diego Padres | 3 | 2.5 | -0.5 | 2.3 | -0.7 |
| Arizona Diamondbacks | 6 | 5.48 | -0.52 | 5.04 | -0.96 |
| Los Angeles Dodgers | 10 | 9.28 | -0.72 | 8.24 | -1.76 |
| New York Yankees | 17 | 16.14 | -0.86 | 14.26 | -2.74 |
| Houston Astros | 8 | 6.89 | -1.11 | 7.83 | -0.17 |
| Atlanta Braves | 12 | 10.83 | -1.17 | 11.51 | -0.49 |
| St. Louis Cardinals | 12 | 10.79 | -1.21 | 11.34 | -0.66 |
| Colorado Rockies | 4 | 2.71 | -1.29 | 2.09 | -1.91 |
| Chicago Cubs | 8 | 6.57 | -1.43 | 6.49 | -1.51 |
| Minnesota Twins | 7 | 5.07 | -1.93 | 2.86 | -4.14 |
So why can’t the M’s catch a break after seventeen long years of frustration? Well, for a couple reasons: (1) That’s not how probability works. Past outcomes do not affect future probabilities. If I flip a coin and get ten heads in a row, the odds of getting heads an eleventh time are still 50-50. A baseball doesn’t remember previous seasons and then adjust its path accordingly. (2) As many of you may have seen by now, the AL has a parity (read: tanking) problem, where bad teams appear worse and good teams appear better. The standard deviation of win percentages in the AL is the largest in either league since 1962 and the range is the largest since 1954 (thanks Baltimore). This wide spread means that just being good won’t cut it. Only absurd 97-win seasons will keep you in the running, a feat that was achieved by the second wild card Oakland Athletics.
So to mentally put this season to bed, the 2018 Mariners are either extremely lucky or unlucky based on what statistics you look at. I choose to see it in a positive light as a lucky one, but all of this analysis boils down to the age-old philosophical question of whether your beer is half empty or half full. Regardless, order another one because professional sports’ longest playoff drought is lasting at least another year and the A’s and Astros are playing in October.